July 16, 2021 – As part of our goal to continuously improve the kegg app and make sure the experience is satisfying our growing community of women, we are proud to announce one of the most important updates for the kegg app so far (version 1.3.0) with some of the most desired features kegg users have been asking for. Let’s deep dive into what’s new in the app and what these improvements will do for kegg users.
Trend Line
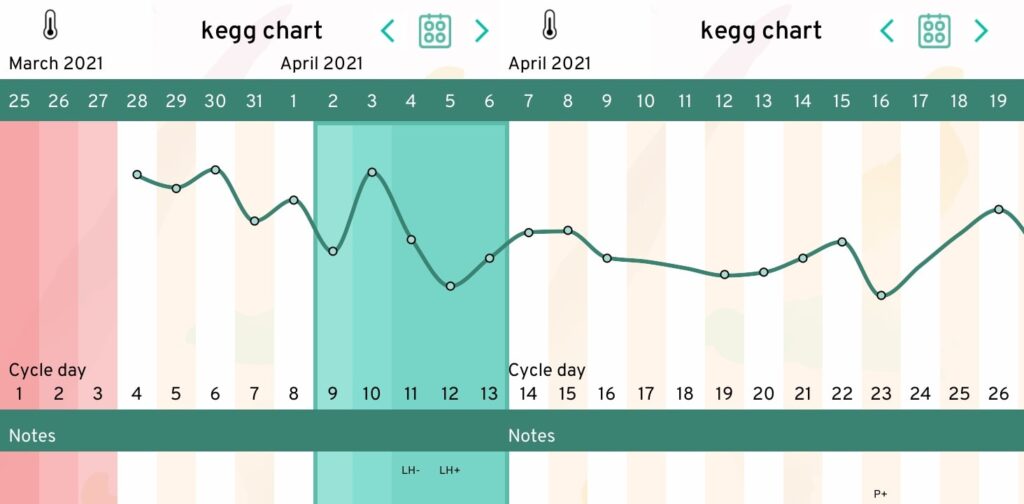
The new trendline display will put more emphasis on the overall trend of readings rather than day-to-day fluctuations. In this example we can see the readings from cycle day 5 through 9 seem a bit erratic. The trendline helps me see that while the readings themselves are fluctuating, the overall trend is downward. We can also see big fluctuations in readings towards the end of the cycle but the trendline shows it’s relatively steady.
BEFORE
NOW
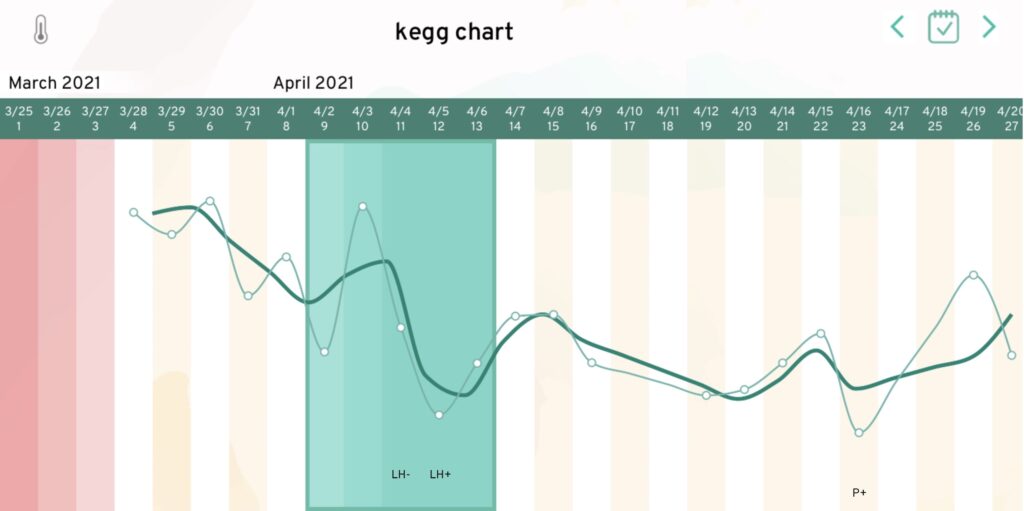
The trendline will be especially helpful for cycles that might have “saw tooth” readings to be seen as a downward, upward, or steady trend.
Landscape view
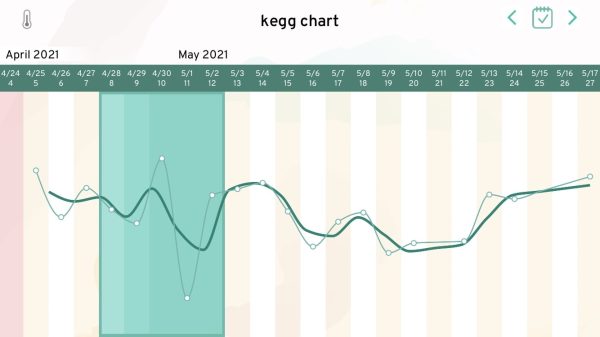
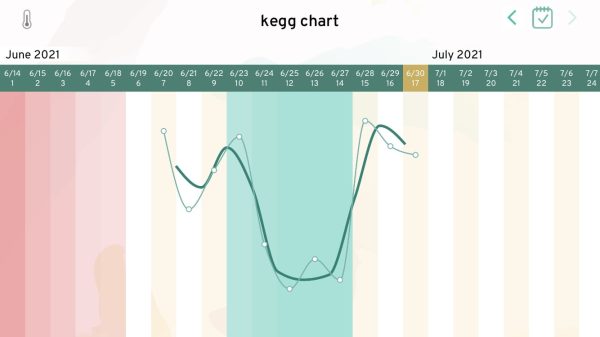
We know this feature has been at the top of our user wishlist! With this app update, users will now be able to view their kegg charts in landscape mode. You’ll be able to visualize roughly 24-30 days in total depending on screen size.
Additional notes & Journal entries
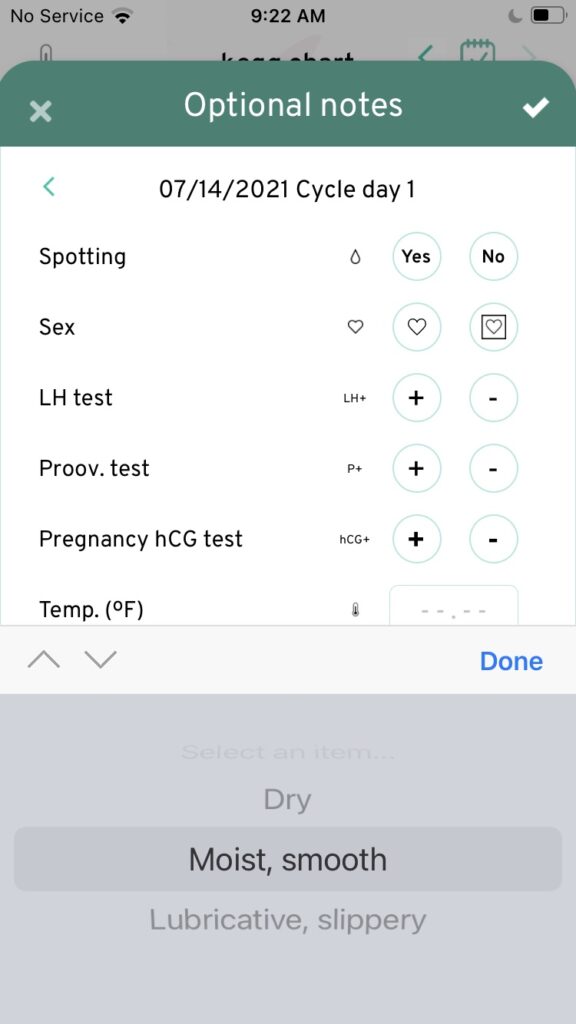
An optional item we have received many requests for is a way to record cervical mucus observations in the kegg app. Users can now record their observations as they wish. We have provided five categories for cervical mucus:
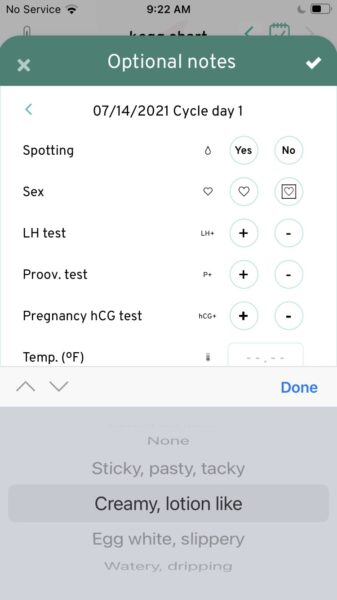
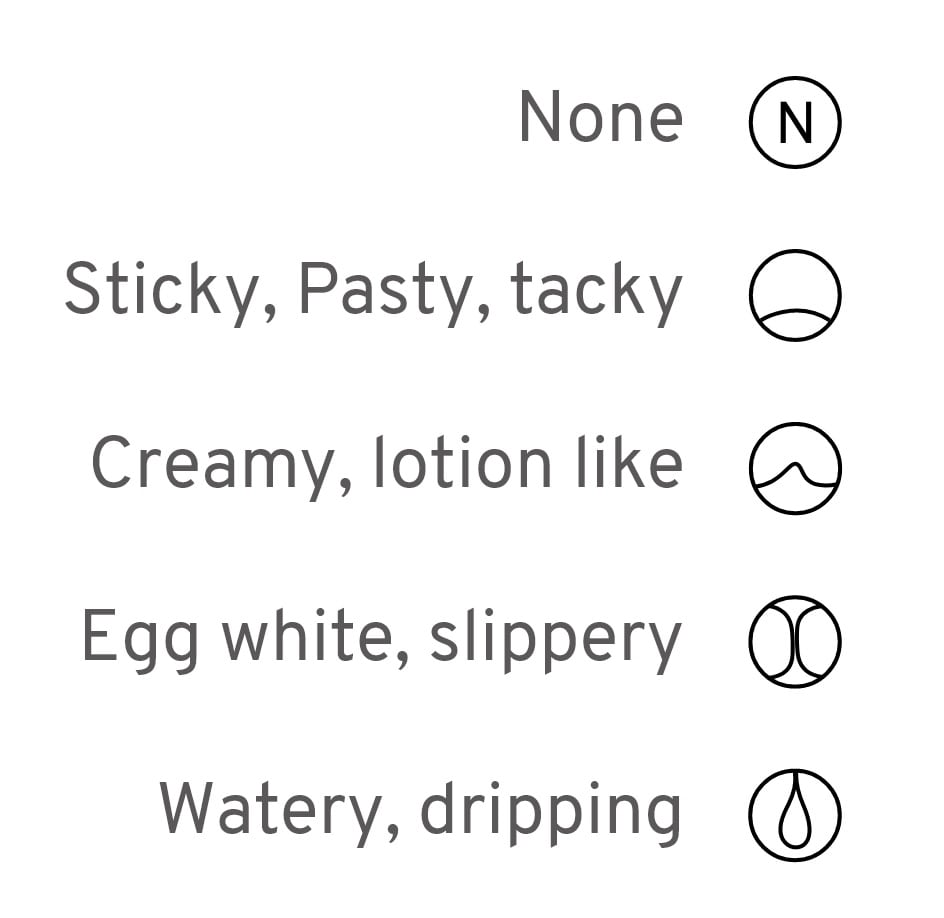
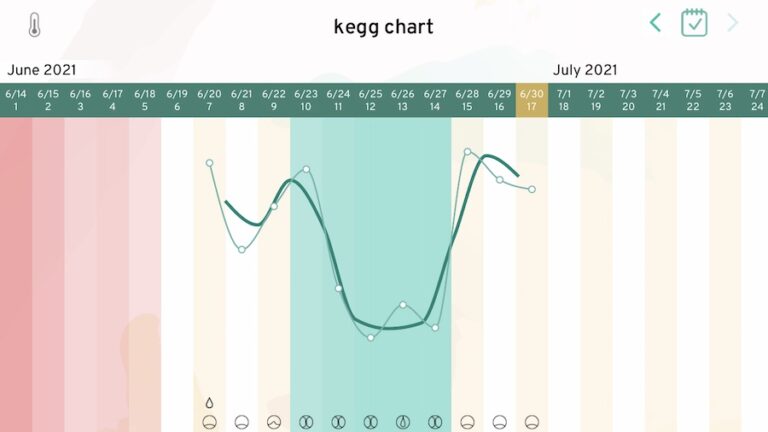
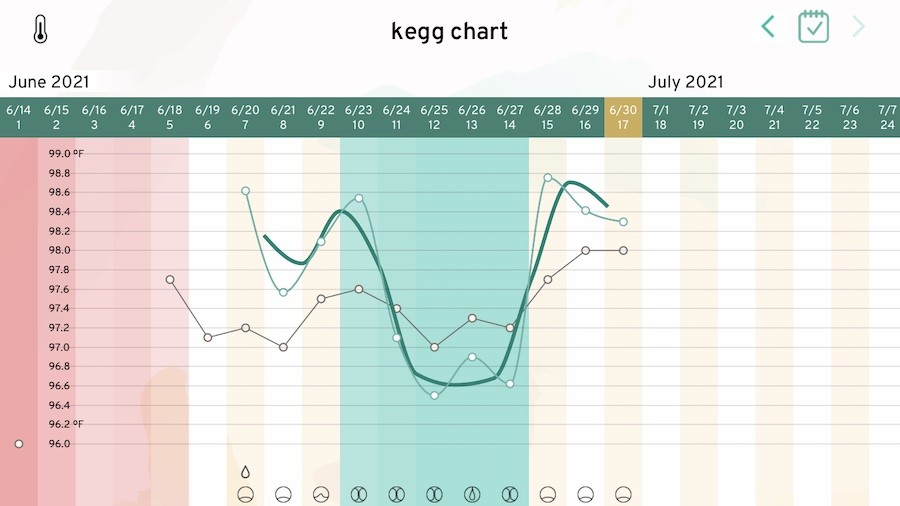
Recorded Cervical mucus observations will appear in your kegg chart
Users can now also record: Vaginal sensation, Sex drive, Infection and journal entries!
Vaginal Sensation
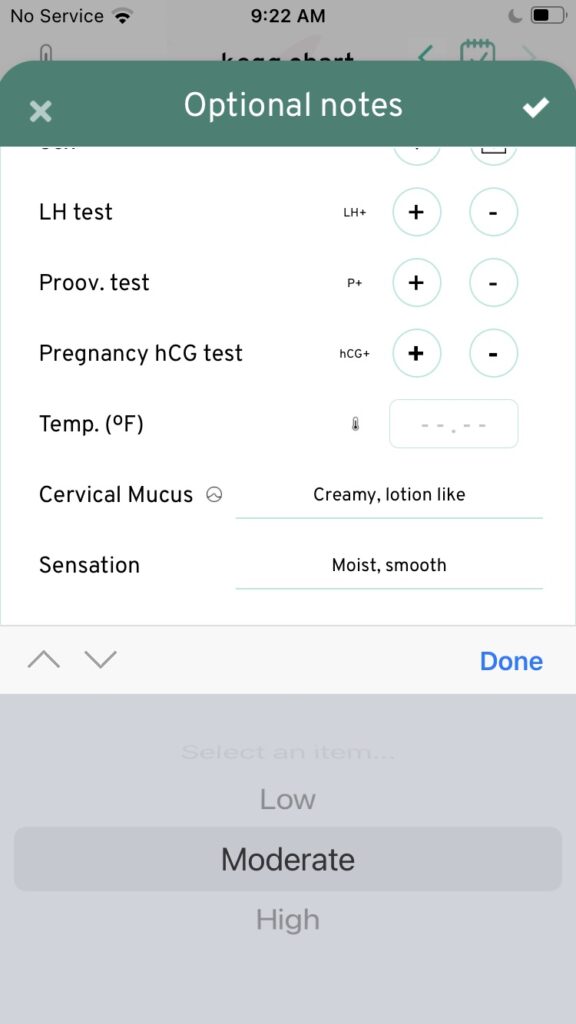
Sex Drive
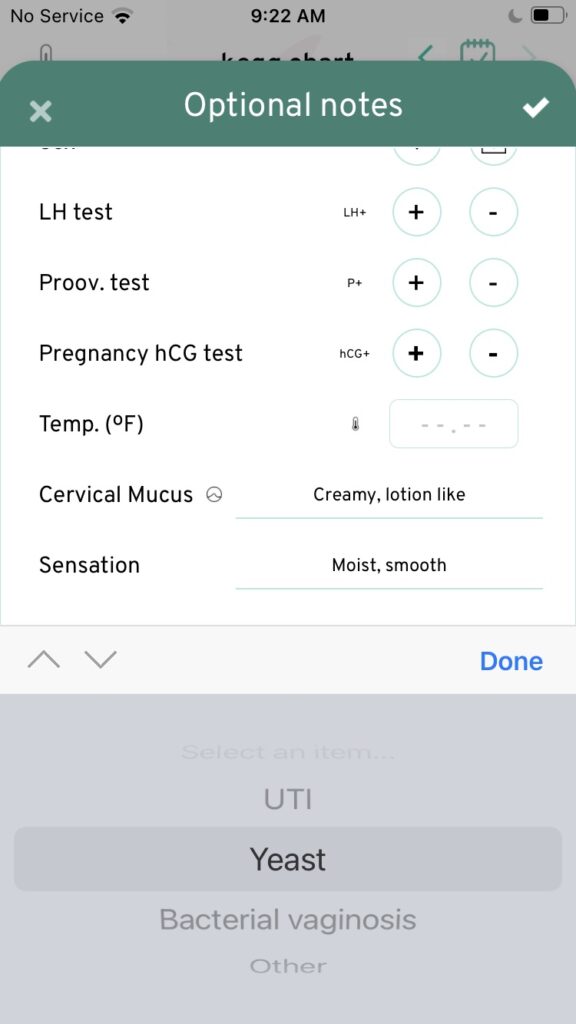
Infection

And journal entries!
Optional Temperature and kegg readings overlap
We listened to your requests! Users that track their temperatures can now see them in their kegg chart! By tapping on the temperature icon at top left, users can turn on and off the temperature display. Here is my personal chart of kegg readings, temperature, and cervical mucus observations.
Within the profile, users can now change their fertility goal. They can also go to completed cycles and add optional fertility notes as they wish
Flagged Readings taken outside the 2hr time frame
Taking your daily kegg readings within the same 2 hour time frame each day is key to providing the most accurate data. In the new app, If a reading is taken more than 90 mins from your selected reading time it will be highlighted in red on your chart. This is simply a visual note that this reading may be inaccurate especially if it does not flow well with its neighboring readings or if the overall pattern does not reveal an obvious fertile valley. These readings are not discarded from the algorithm. The different color simply helps the user and kegg’s user support to make note of any readings that might not be accurate.
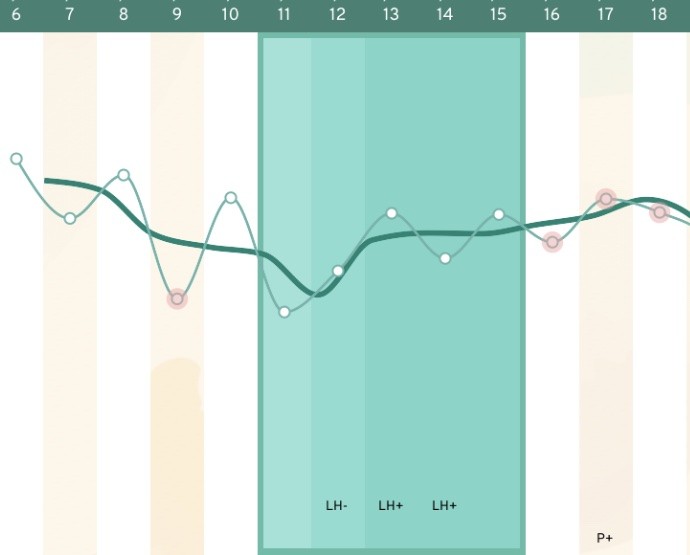
See readings on cycle days 9, and 16-18 in the chart to the right. kegg was still able to place this user’s fertile window confirmation properly. But the readings and trend are not clear. If the user had taken all readings in the appropriate time frame we can expect the results would show a more recognizable fertile valley.
Fertile window display in Completed cycle without enough readings
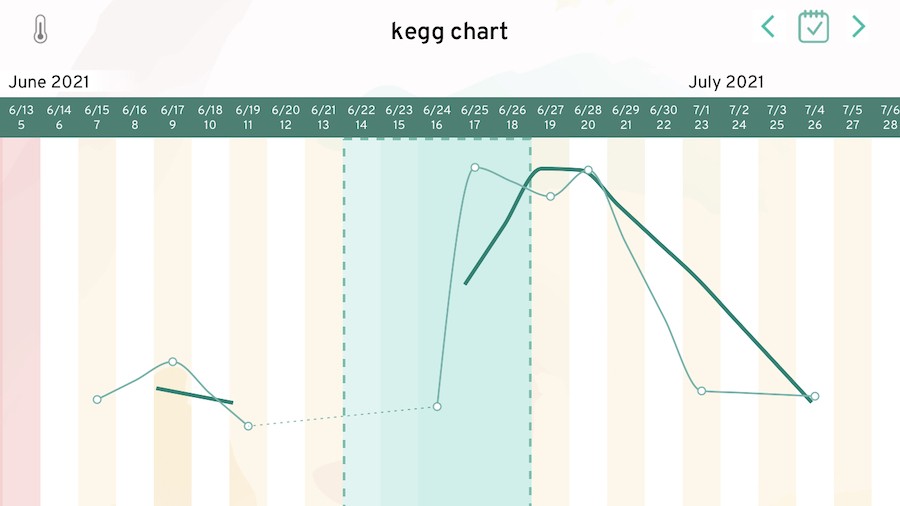
When a kegg cycle is completed the algorithm looks at the full cycle and places a fertile window confirmation. kegg needs enough readings within the cycle to place the fertile window. If there are not enough readings or no readings at all, kegg will place a best approximation and display the fertile window in lighter colors with a dashed border. If you have this display keep in mind that kegg needs consistent use throughout the cycle to give the user the most accurate fertility insights.
Improved fertile window display for completed cycles
New cycle and no readings yet. Light colors dashed border
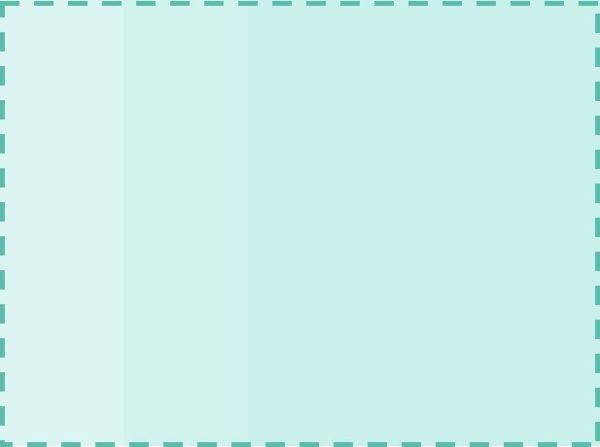
Current/active cycle after the first reading. Medium colors and no border

Completed cycles with enough readings. Dark colors and solid border

Completed cycle with not enough readings. Light colors dashed border

Last, you’ll also be able to change your fertility goal within the app!
To update the kegg app using the app store available on your mobile device, follow the instructions below.
iOs – App store
- Open the App Store.
- Tap your profile icon at the top of the screen.
- Scroll to see pending updates and release notes.
- Tap Update next to an app to update only that app ((The latest kegg app version should be here) or tap Update All.
Android – Google Play Store:
- Open the Google Play Store app.
- Tap Menu My apps & games.
- Apps with an update available are labeled “Update.” (The latest kegg app version should be here!).
- You can also search for a specific app.
- Tap Update.
Still have questions? No problems, we got you covered.
What is the trend line?
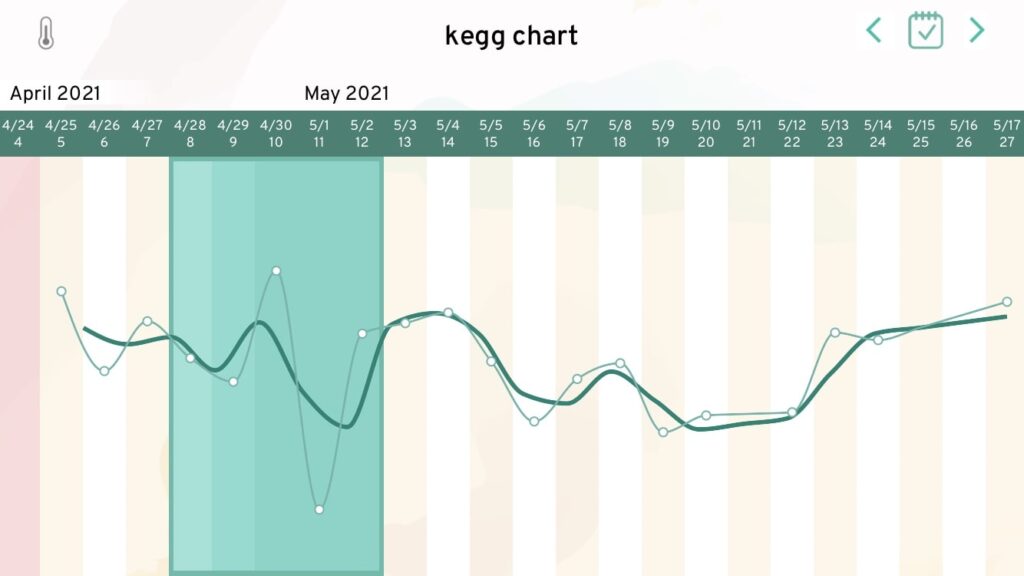
kegg’s new trendline is a visual aid for users to discern the overall pattern of their readings rather than focusing on the day-to-day fluctuations. For some charts the trend line will generally follow the same pattern as the daily readings. For other charts with significant ups and downs. The trend line will help to define whether a group of readings are descending, ascending or steady.

Should I follow the trend line or my single daily readings?
The trendline and daily readings line can be thought of as partners to help you see your overall trend in readings. Users will sometimes put too much focus on day-to day fluctuations but kegg’s intelligent algorithm does the work for you by assessing your readings and cycle trends to determine the best fertile window predictions. The trend line will help to better see the overall trends of fluctuating day to day readings.
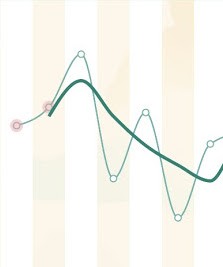
In this example we see there is a one day rise in the middle of this user’s fertile window. The trendline helps to see that the trend of readings is still lower than the readings before and after the fertile window.
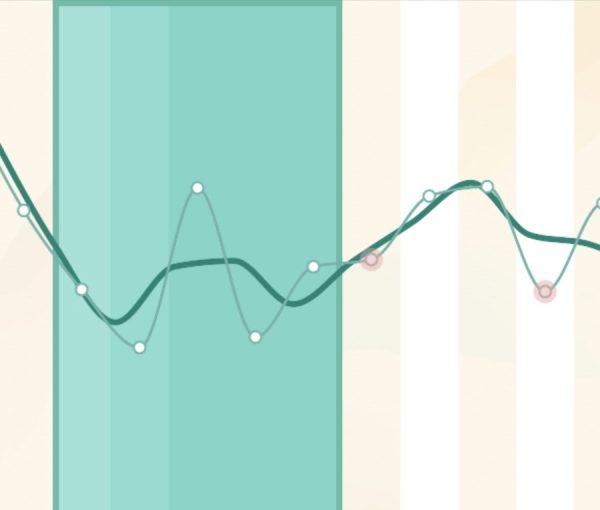
Some of my measurements are far from the trend line, what does it mean?
Occasional jumps and drops are within normal. If you find the majority of your readings fluctuate significantly consider any of the following factors that can contribute to erratic readings:
- Taking readings outside of a consistent 2 hour time frame.
- Using different positions for readings (some standing, some laying down)
- Moment during the reading.
- Not inserting kegg fully
- Taking readings too soon after sex
- Significant stress, change in daily routine or travel
- Inconsistent hydration
- Illness or infection
- Presence of foreign substances like vaginal medication, ointment, or lube.
Why are some of my readings circled in red?
Taking your daily readings within the same 2 hour time frame each day is key to getting the most out of your kegg data. If a reading is taken more than 90 mins from your selected reading time it will be highlighted in red on your chart. This is simply a visual note that this reading may be inaccurate especially if it does not flow well with its neighboring readings. These readings are not discarded from the algorithm. The different color helps you and user support to make note of any readings that might not be accurate.
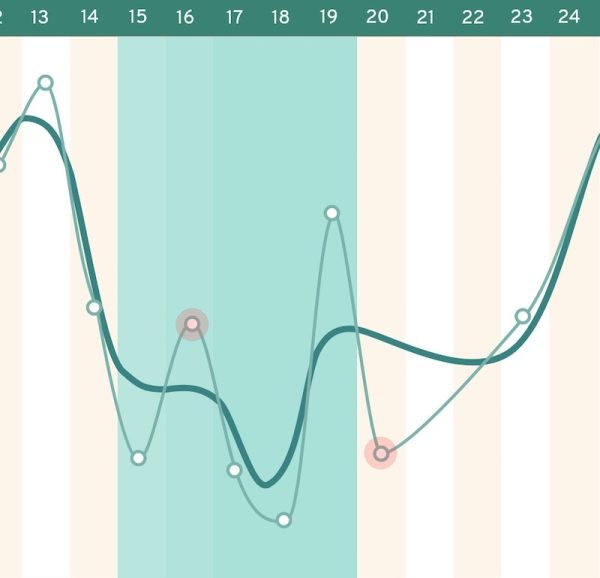
Should I expect a ‘valley’ in the trend line when my FW opens?
For both the trend line and daily readings, users will most often see a fertile valley in or near their predicted fertile window. Some cycles can have a single day drop or very subtle shifts through the cycle. For these cycles the trend line may stay relatively flat.
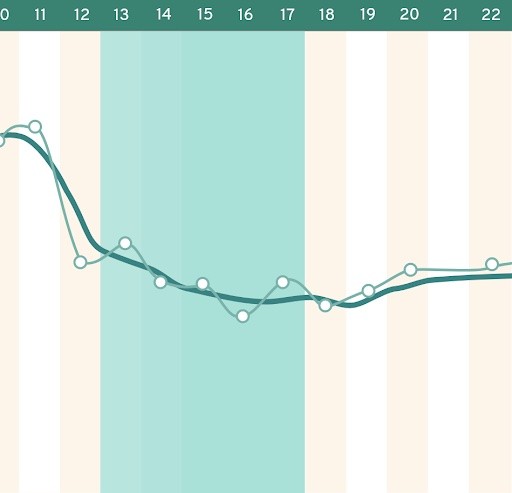
Why is the fertile window in my finished cycle light with a dashed border?
kegg’s algorithm needs consistent readings throughout the cycle to place the fertile window confirmation in completed cycles. If there are not enough readings in a cycle, kegg will approximate the fertile window placement.
In the example shown, the user has missed readings throughout the cycle and has missed readings during her fertile window prediction. kegg does not have enough information and is placing it’s best approximation based on the user’s cycle history.
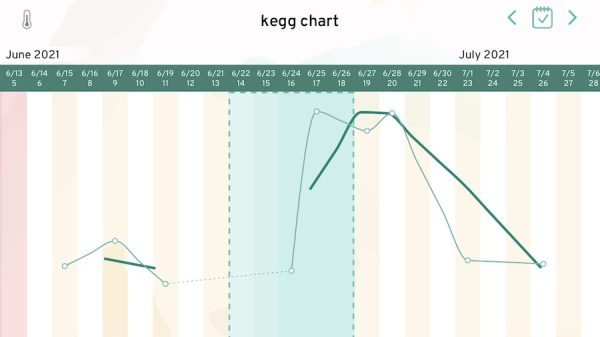
Why don’t I see a trend line after my first reading?
kegg’s trend line will assess an average between the previous and current day’s reading. Kegg needs a few readings before it will begin to display this information. After the 3rd reading kegg will begin displaying your trend line.
Need support? Please reach out to us.
