- For trying to conceive, you will want time sex or insemination on days with lower readings in and around the green days. If your cycles are especially long or irregular, we recommend timing sex or insemination on any days with lower readings.
With daily readings taken throughout the cycle, kegg records electrolyte level trends in the cervical fluid. Cervical fluid changes in response to hormones in the body. kegg’s algorithms survey the patterns of your daily readings over time to identify past fertile windows and predict future fertile windows. Your prediction will be a set of 5 green days labeled as ‘’Low’’, ‘’Possible’’ or ‘’Likely’’.
Each cycle will have a unique kegg trend. In general, most ovulatory cycles display the following pattern: As estrogen rises the body prepares to ovulate, kegg readings descend lower on the kegg chart. We describe this dip in readings as a “fertile valley”. During the dip in kegg readings the vaginal environment and cervical fluid are hospitable and nourishing to sperm. It is ideal to time sex or insemination on these days to optimize chance of conception.
On or after ovulation, the shift in hormones causes a shift in electrolytes, resulting in a rise in kegg readings. Below we explore variations of normal fertile window trends.
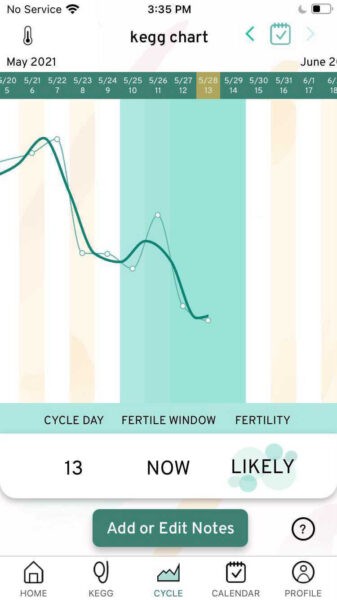
This chart shows a stair-step progression down throughout the follicular phase (before ovulation). These fluctuations which occur both before and after ovulation are normal. The predicted green fertile window captures the valley shape as there is a downward trend followed by the rise on cycle day 21. Note: it is very typical to have fluctuations in readings even within the fertile window (like we see with the reading on cycle day 19, followed by another dip on cycle day 20. kegg is able to see beyond day-to-day fluctuations and focus on the overall trend.
This chart also shows a dropping trend after ovulation. Note that kegg readings do not need to remain elevated after ovulation. Dips in kegg readings after ovulation do not indicate a problem and they do not suggest declining progesterone.
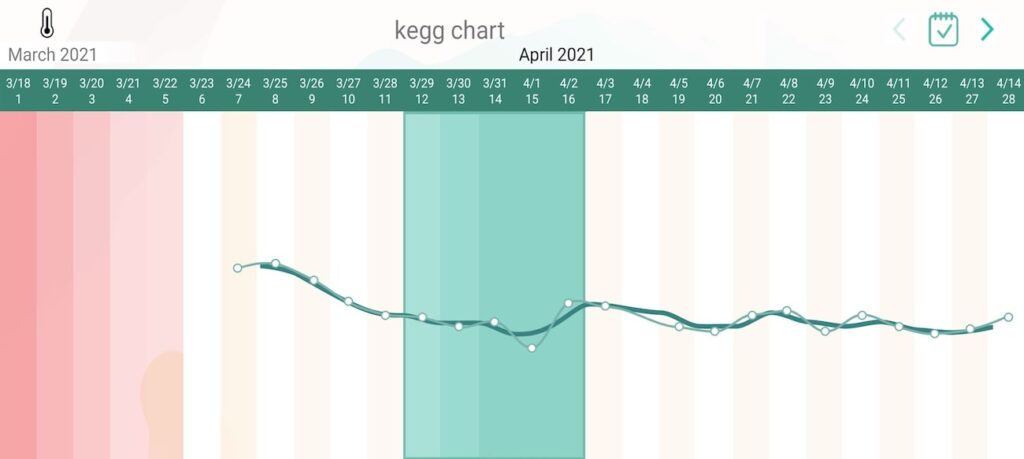
In this completed chart, the valley shown is very subtle. There is a gentle downward trend beginning on cycle day 9. The fertile window confirmation in green captures a continued descent through cycle day 15 followed by a slight rise on cycle day 16. This valley, although subtle, is very typical and does not indicate a problem. kegg is able to capture and detect even these slight variations.
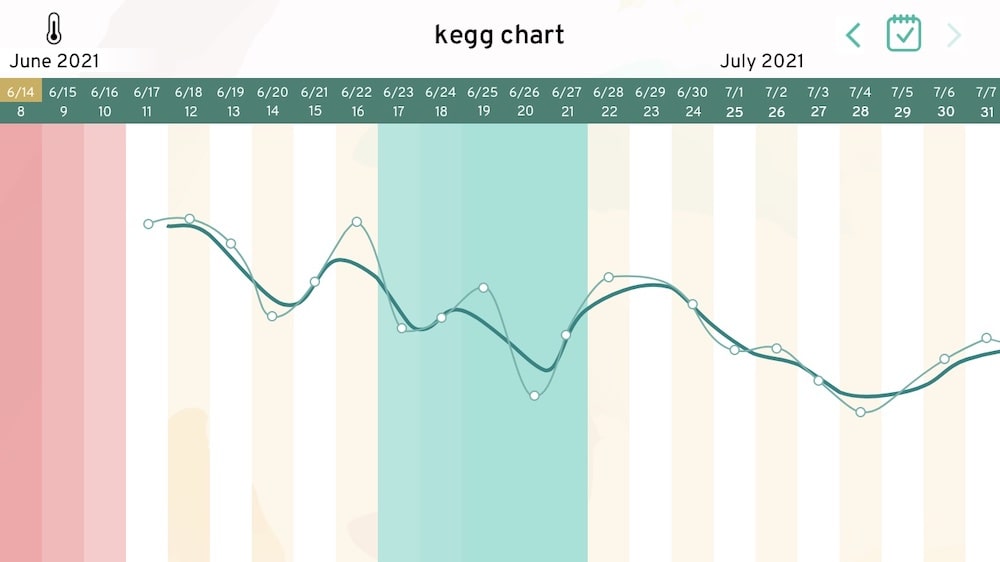
This chart features a deep descent into the fertile window prediction. In contrast to the previous chart, some cycles will have a more significant dip in kegg readings leading up to and in the fertile window prediction. This is again a common trend and does not indicate a problem. While we see a jump in readings on day 11, the overall trend is downward and these day-to-day fluctuations are normal.
Check out our blog kegg chart 101 for more examples of kegg charts with explanations.