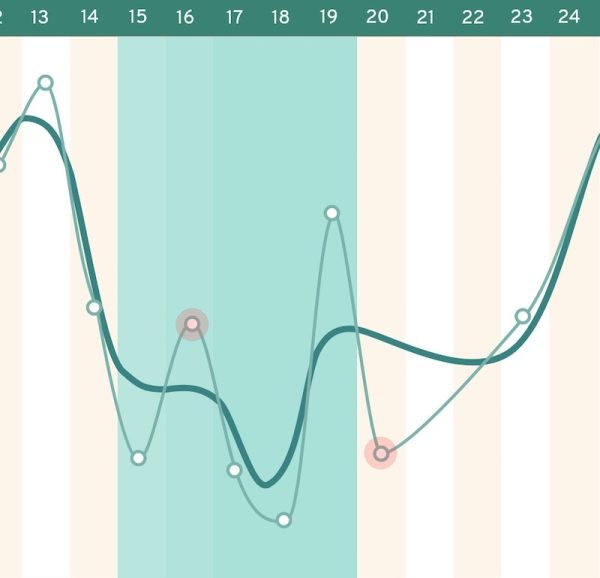
Taking your daily readings within the same 2 hour time frame each day is key to getting the most out of your kegg data. If a reading is taken more than 90 mins from your selected reading time it will be highlighted in red on your chart. This is simply a visual note that this reading may be inaccurate especially if it does not flow well with its neighboring readings. These readings are not discarded from the algorithm. The different color helps you and user support to make note of any readings that might not be accurate.